Gestion Des Projets IA - Optimisation Des Processus Business - Science & Analyse De Données

Boostez votre productivité avec l'intelligence artificielle et l'automatisation.

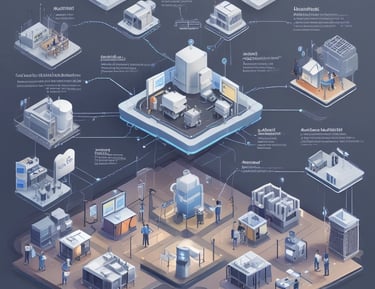
Mise En Place Des Plateformes D'automatisation Des Processus Business

Orchestrateur d'Agents IA Dans Les Projets d' IA

Specifications Driven Development (SSD)

An abstract, pastel-colored, 3D-rendered representation of data analysis and search engine optimization (SEO). The image features a computer interface with various analytics symbols, including a magnifying glass, bar charts, pie charts, and a search bar with the text 'SEO'. Surrounding the interface are different objects such as a potted plant, a cup with a saucer, and a megaphone, all placed on a light green background.
A computer screen displaying a data analytics dashboard with graphs and charts. A blue line graph shows fluctuations in data over time, and a section highlights the number of page views. A pie chart is partially visible, indicating a breakdown of different data elements.
A computer screen displaying analytics dashboards with various charts, including a line graph on the left and a cohort analysis table on the right. The table is populated with different shades of blue, indicating varying levels of user activity over several weeks. Text labels and numbers detail user retention statistics.

À propos de Georges Eric Djoufack

Georges Eric Djoufack est un Chef de projet IA, Orchestrateur d'agents IA, Expert en optimisation des processus, Analyse et Sciences De données, Utilisant l'IA pour améliorer la productivité et la prise de décision.

A laptop with an open screen displaying dashboard analytics featuring charts, graphs, and numerical data related to sales and subscriptions. The interface is predominantly dark-themed with sections highlighting key performance metrics. The device shown is a MacBook Pro, indicated by the keyboard layout and branding.
Expertise et innovation au rendez-vous.

Georges

"

Services d'analyse IA

Optimisation des processus et analyse avancée pour une prise de décision éclairée.

Analyse de données
A digital dashboard displaying various analytics charts and graphs. There is a line graph showing user engagement over time on the left, a section with total revenue marked as $74K, and bar charts illustrating user statistics by region. The central section highlights users in the last 30 minutes, focusing on different countries such as the United States, Canada, India, Pakistan, and Brazil.

Analyse Des Données et Science Prédictives à l'aide des données d'entreprise

A digital screen displaying analytical data with line graphs, histograms, and numerical values. The data is presented in a user-friendly interface with different shades of blue used to distinguish various elements.
A smartphone displays analytics data with graphs showing views, downloads, and likes. It is resting vertically on a white dock next to a small potted succulent plant. In the background, a large computer monitor is partially visible, along with a closed laptop and a white wireless earbud case.
Automatisation intelligente

Automatisation des process métiers, pour stimuler l'efficacité et réduire les coûts opérationnels dans les entreprises

Mise En Place Des Plateformes IA D'automatisation Des Processus Business, par Orchestration Des Agents IA.

Gestion de projets

Mise En Place Des Plateformes IA D'automatisation Des Processus Business, par Orchestration Des Agents IA.

Contactez-moi

Pour toute question ou collaboration, n'hésitez pas à me contacter. Je suis disponible pour discuter de projets d'analyse et d'IA.

Questions
Support

eric@djoufack.com

woman wearing yellow long-sleeved dress under white clouds and blue sky during daytime

Georges Eric Djoufack a transformé notre approche grâce à son expertise en analyse de données et IA.

Sophie L.

An iPad displaying data visualization content next to a book titled 'Data Science for Business.' The iPad is showing notes and a diagram about dashboard design, accompanied by a stylus placed between the iPad and the book.

Son approche méthodique et ses compétences en automatisation ont considérablement amélioré notre productivité et efficacité.

Marc T.

A man in a suit is working at a desk with a dual-monitor setup showing SEO presentation slides and data charts. The office environment is bright, with natural light coming from a nearby window, and a Rubik's cube is placed in front of the monitor.
★★★★★
★★★★★